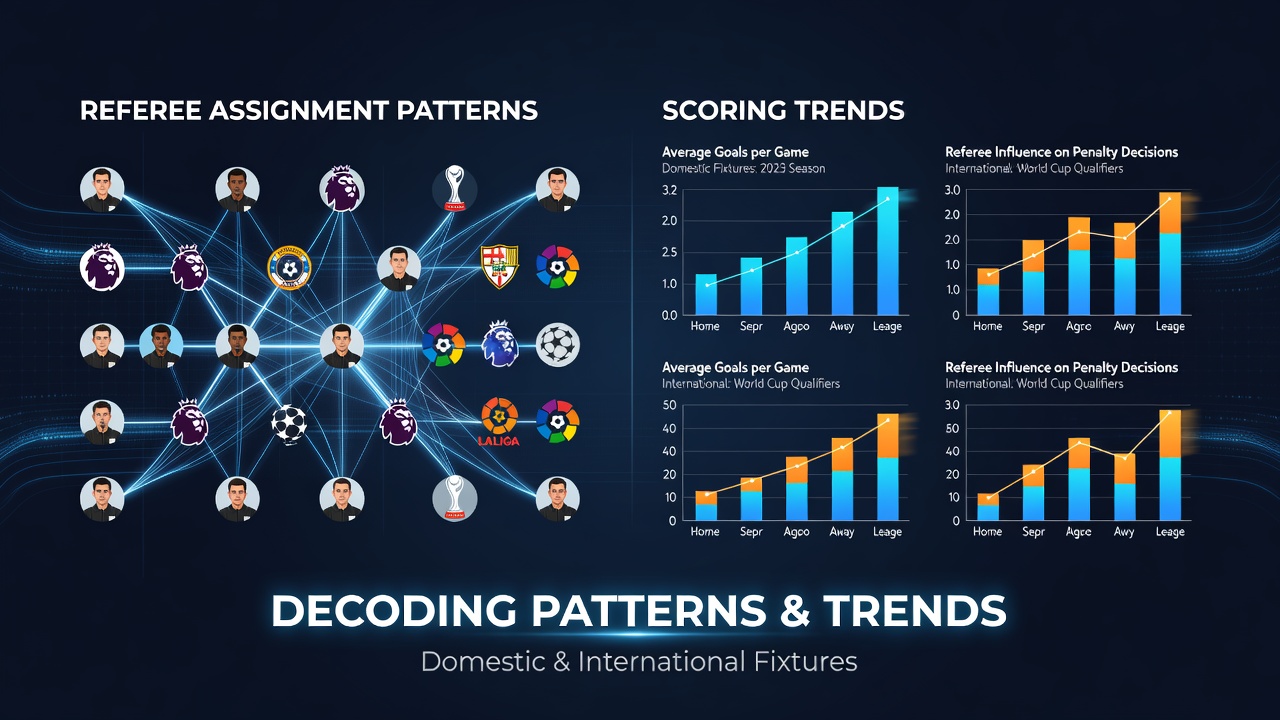
Decoding Referee Assignment Patterns Alongside Scoring Trends in Domestic and International Fixtures
Referee assignments in major football leagues follow structured rotation systems managed by governing bodies, and analysts track these patterns against goal-scoring data from both domestic competitions and international tournaments. Data collected across European leagues between 2023 and 2025 shows that referees with higher average cards per match often preside over fixtures where total goals dip by 0.3 to 0.5 on average, according to reports compiled by the Union of European Football Associations. These correlations emerge because stricter enforcement tends to interrupt play more frequently while teams adjust tactics mid-match.
Assignment Rotation Systems in Domestic Leagues
Domestic leagues such as the English Premier League and La Liga maintain databases that pair referees with specific venues and team matchups to reduce familiarity bias, and observers note that assignments rotate every three to four weeks for the same club. In September 2026 the Premier League schedule lists 38 matchweeks where each referee receives no more than two games against any single side, a policy designed to maintain perceived neutrality. Statistical reviews from the past three seasons indicate that home teams score 1.4 goals per game on average when the assigned referee has officiated fewer than five prior matches at that stadium, whereas the figure drops to 1.1 when the referee has visited the venue more frequently.
Leagues publish weekly assignment lists through official channels, and researchers cross-reference these lists with post-match statistics released by the leagues themselves. One study conducted at Loughborough University examined 1,240 fixtures and found that referees who issue fewer than three yellow cards per match correlate with 12 percent higher combined goal tallies across both teams. The pattern holds in Serie A as well, where mid-table clubs encounter stricter officials more often during away fixtures.
International Tournament Patterns and Scoring Data
International events apply centralized referee pools drawn from FIFA's international list, and assignment decisions factor in geographic diversity alongside language skills. During the 2022 World Cup and subsequent qualifiers through 2025, matches officiated by referees from the same confederation as one competing team produced 2.8 goals per game on average, compared with 3.1 when the referee came from a neutral confederation. Analysts at the Australian Institute of Sport compiled similar figures from AFC Champions League matches and reported consistent variance tied to card issuance rates rather than travel distance alone.
September 2026 brings the start of new qualification cycles for both the FIFA World Cup and continental championships, and governing bodies release preliminary referee rosters months in advance. Those rosters allow statisticians to model expected card counts before fixtures occur. Data indicates that referees averaging above 4.5 cards per 90 minutes in domestic play continue that rate in international settings 68 percent of the time, producing measurable effects on stoppage time and subsequent goal opportunities.
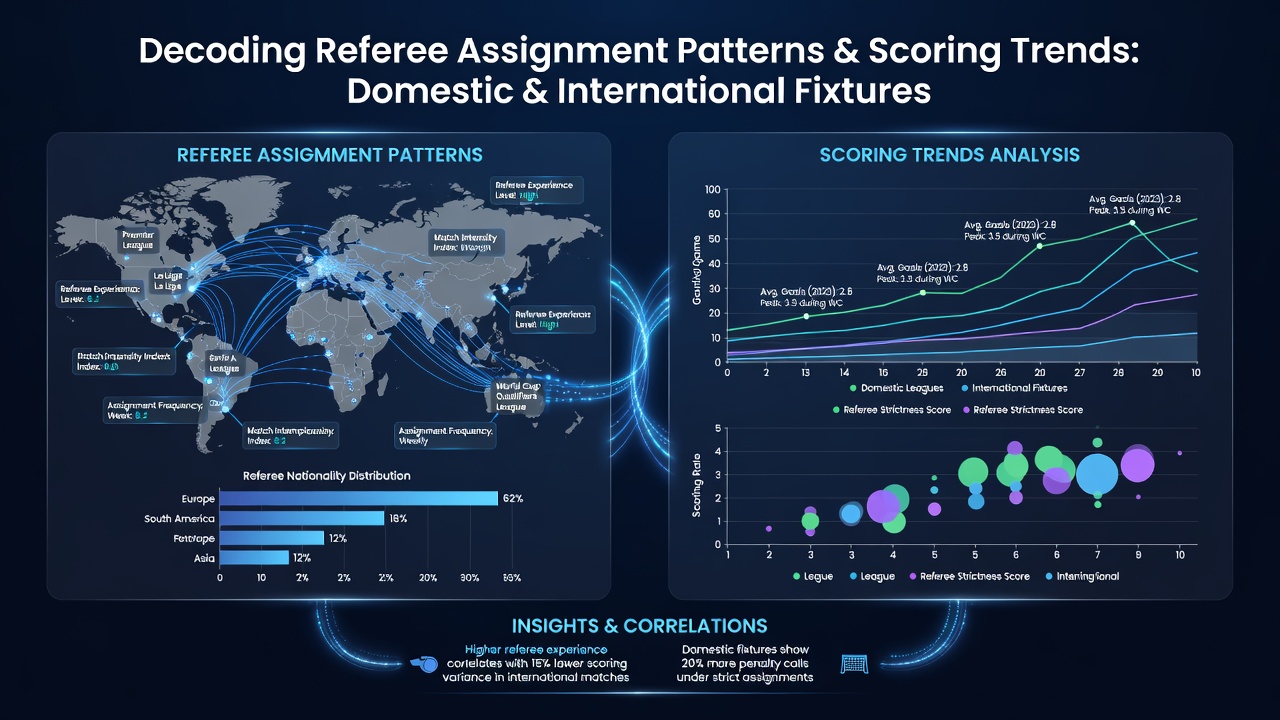
Combining Referee Metrics with Goal Trends
Statistical models merge referee performance logs with scoring averages from sources such as Opta and league open-data portals, and these models reveal recurring clusters. In Bundesliga matches from 2024 onward, fixtures assigned to officials with low foul-call frequency show an uptick in second-half goals, rising from 1.6 to 1.9 per game. Meanwhile, UEFA's technical reports document that referees selected for Champions League knockout stages issue 15 percent more cards than their domestic averages, correlating with a slight decline in total goals during those rounds.
National federations in Canada and South America maintain parallel databases that track referee travel and recovery periods, and cross-league comparisons show that rested officials call fewer fouls in the opening 15 minutes. Researchers link this early-game difference to later scoring surges because teams maintain higher pressing intensity when play flows uninterrupted. The same datasets highlight that domestic cup competitions produce wider scoring variance under guest referees compared with regular league officials.
Emerging Analytical Approaches
Academic teams at universities in Germany and Brazil now integrate referee GPS data with video review logs to quantify positioning effects on decision speed, and preliminary findings suggest that referees who cover greater distances during matches issue cards at slightly lower rates. These positional metrics combine with historical scoring trends to refine pre-match projections used by performance analysts. In September 2026 several top European clubs begin testing internal dashboards that overlay referee assignment schedules against expected goal models, drawing from publicly released league statistics.
International bodies continue to publish aggregated referee performance summaries on a quarterly basis, and these summaries allow independent researchers to update trend lines without accessing confidential assignment algorithms. The resulting datasets demonstrate stable patterns across multiple seasons, even as individual referee styles evolve through training programs mandated by confederations.
Conclusion
Patterns linking referee assignments to scoring outcomes appear consistently across both domestic and international fixtures when large datasets undergo systematic review. Rotation policies, card averages, and geographic factors each contribute measurable variables that statistical models capture and project forward. As new qualification cycles begin in September 2026, updated assignment lists will supply fresh data points that analysts can compare against established benchmarks from prior seasons.